In June, Canada added nearly a quarter of a million net new jobs, according to the assembled and published by Statistics Canada. The +231,000 increase, however, was not comprised of a usual mix of gains in both full-time and part-time work. Rather, full-time employment shrank by -33,000 jobs while part-time endeavors took off to the tune of +263,000 positions.
Total employment in Canada is now +8.1% year over year, with full-time work at +6.0% and part-time work at +18.0%.
The boost in part-time work has come from an uptick in the ‘accommodation and food services’ sector, where employment is now +16.8% year over year, and it has benefitted younger workers. Employment among individuals aged 15 to 24 is now +25.5% year over year.
Canada’s jobs recovery ratio, versus the scary plunge from February to April of last year, has improved to 88.6%. In services, the jobs claw-back ratio has climbed above 90%. In the public or government sector, whatever job losses there were in the Spring of last year have been retrieved and then some.
Canada’s seasonally adjusted (SA) unemployment rate now sits at 7.8%, down from 8.2% in May. The nation’s not seasonally adjusted (NSA) U rate, though, is a tight 6.0% when adjusted to the same methodological standards as are adopted in the U.S. A 6.0% NSA U rate for Canada is almost an exact match for the comparable U.S. figure of 6.1%.
June was not a good month for Canadian jobs creation in either the manufacturing or construction sectors. Payrolls in the former shrank by -12,000, and in the latter by, -24,000.
Year-over-year employment in manufacturing is presently +5.7%, while in construction, it’s +6.3%. Monthly Canadian housing starts averaging a gain of 50% versus their historical level are underpinning activity by the nation’s construction labour force.
Returning to the ‘all jobs’ picture, British Columbia is the only province with an unemployment rate (6.6%) lower than the national figure and a year-over-year increase in jobs (+11.0%) that is higher than the Canada-wide result (see Graph 3).
Earlier this year, Ontario was recording labour market statistics that were disappointing compared with the other provinces. Lately, though, Ontario has been doing much better with respect to both jobs creation (+8.6% vs +8.1% Canada-wide) and unemployment rate (8.4% vs 7.8% nationally). ����
Graph 1: Canada: Month-to-month Total Employment Change
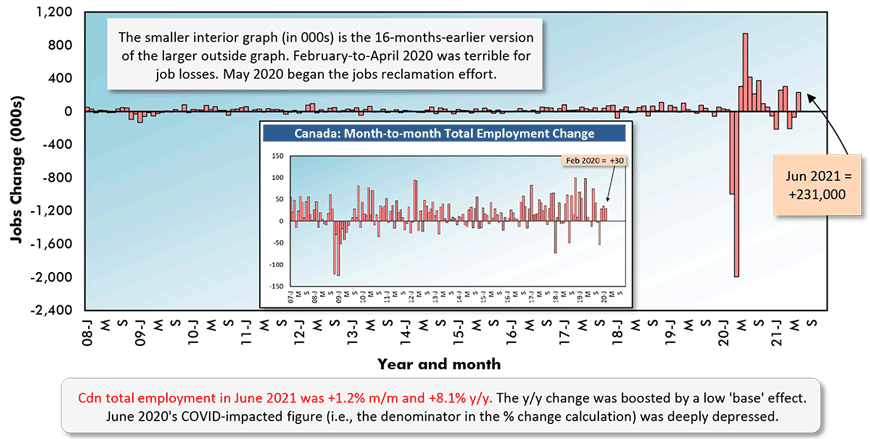
Chart: ����ӰԺ.
Table 1: Monitoring the Canadian Employment Recovery ‒ June 2021
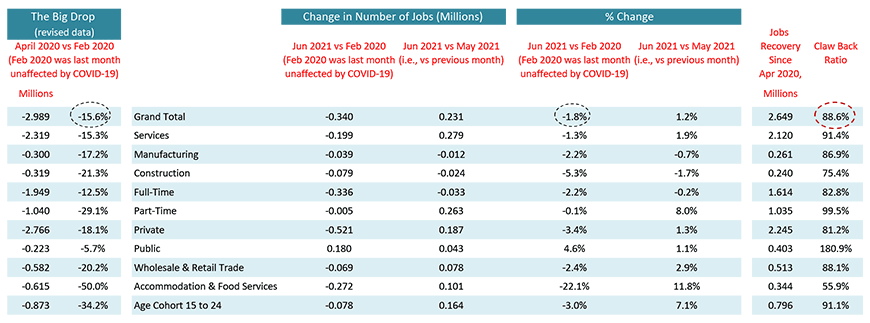
Table: ����ӰԺ.
Graph 2: Manufacturing vs Construction Employment in Canada
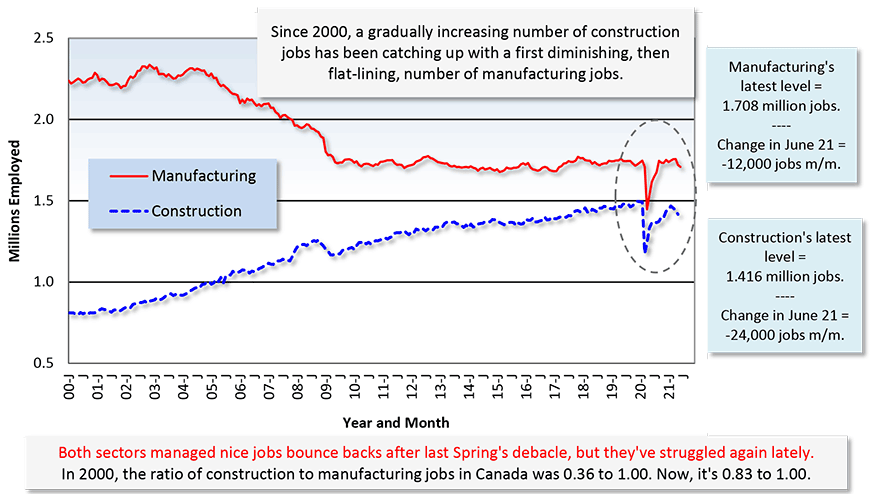
Table: ����ӰԺ.
Table 2: Canada’s Provincial Labour Markets – June 2021
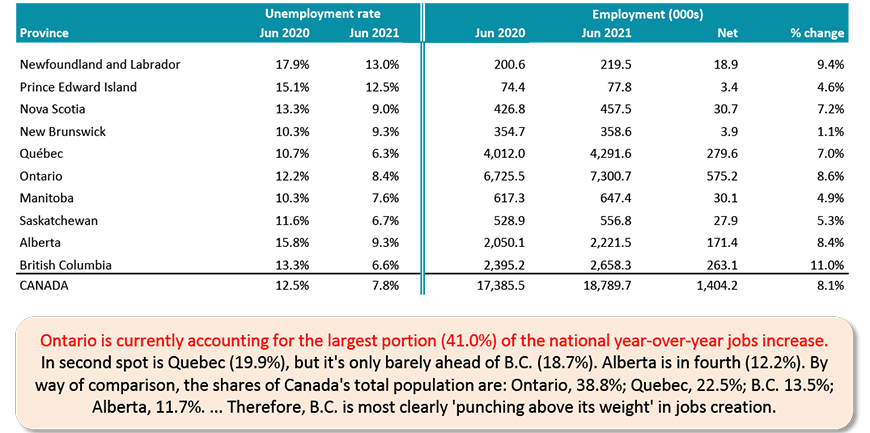
Table: ����ӰԺ.
Graph 3: Canada’s Provincial Labour Markets – June 2021
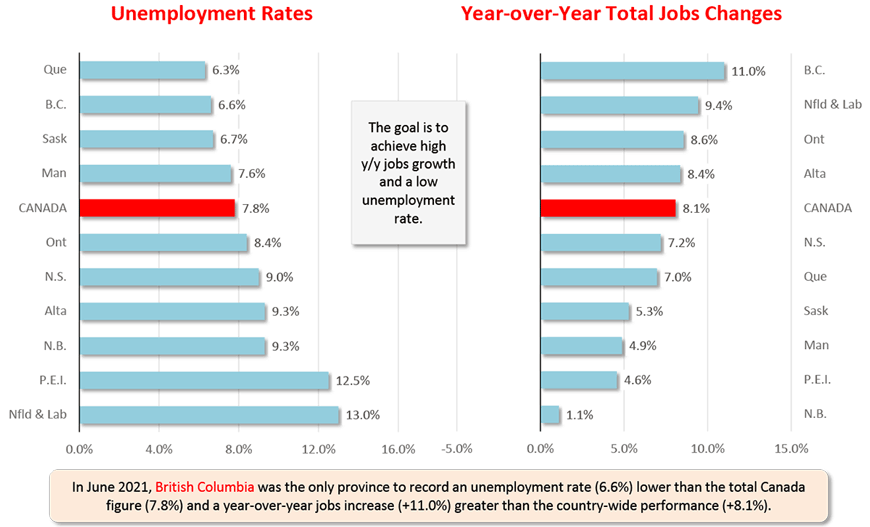
Chart: ����ӰԺ.
Table 3: Canadian Workforce Earnings
Year Over Year, June 2021
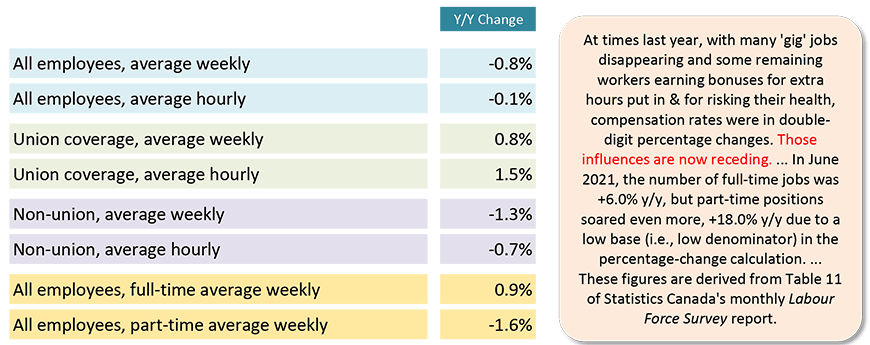
‘Current’ means there has been no scaling back to remove effects of inflation.
Table: ����ӰԺ.
Please click on the following link to download the PDF version of this article:
Alex Carrick is Chief Economist for ����ӰԺ. He has delivered presentations throughout North America on the U.S., Canadian and world construction outlooks. Mr. Carrick has been with the company since 1985. Links to his numerous articles are featured on Twitter , which has 50,000 followers.


Recent Comments
comments for this post are closed