ÌìÃÀÓ°Ôº

Skip to Content

Sites

Economic

1,000-Word Charts: Retail Sales in Canada

Alex Carrick
1,000-Word Charts: Retail Sales in Canada

Due to its complexity, much of the subject matter concerning the economy requires detailed editorial commentary, often supported by relevant tables and graphs.

At the same time, though, there are many topics (e.g., relating to demographics, housing starts, etc.) that cry out for compelling ‘shorthand’ visualizations.

Whichever path is followed, the point of the journey, almost always, is to reach a bottom line or two.

To provide additional value, ÌìÃÀÓ°Ôº is now pleased to offer an ongoing series of 1,000-word charts.

These will help readers sort out the ‘big picture’ more clearly.

These 1,000-word charts look at the latest retail sales figures in Canada, as of June 2021.
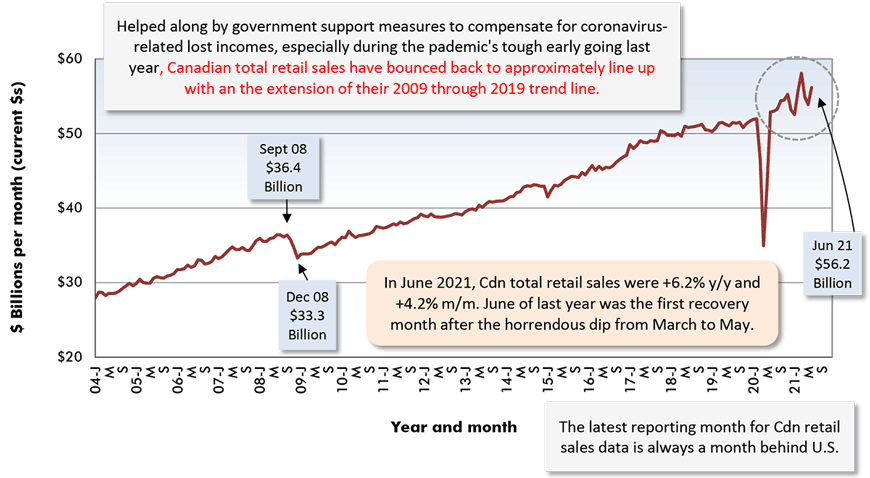
Graph 1: Total Retail Sales in Canada
In June 2021, Cdn total retail sales were +6.2% y/y and +4.2% m/m. June of last year was the first recovery month after the horrendous dip from March to May.
Latest data point is for June, 2021.
Data source: Statistics Canada Table 20-10-0078-01.
Chart: ÌìÃÀÓ°Ôº.
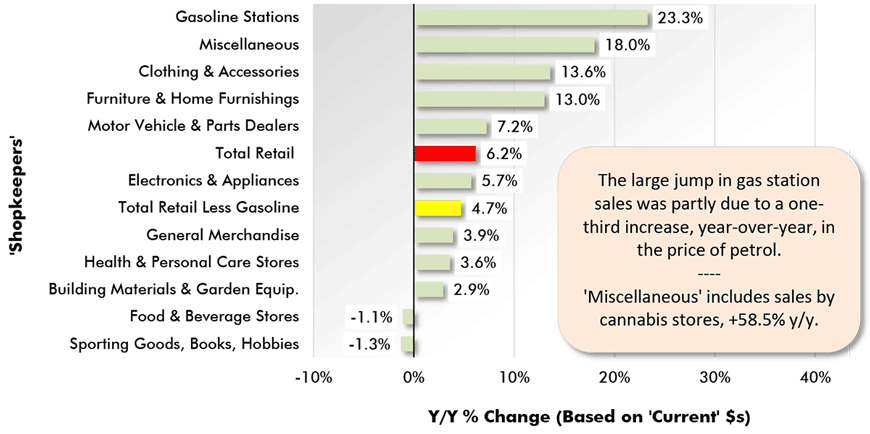
Graph 2: Canada Retail Sales Y/Y – June 2021
The large jump in gas station sales was partly due to a one-third increase, year-over-year, in the price of petrol.
‘Current dollars’ means not adjusted for inflation. Underlying numbers are seasonally adjusted & not ‘smoothed’.
Data source: Statistics Canada.
Chart: ÌìÃÀÓ°Ôº.
Graph 3: Retail Sales – Canada, Provinces & Cities
June 2021 Year-over-Year (Y/Y) & Shares
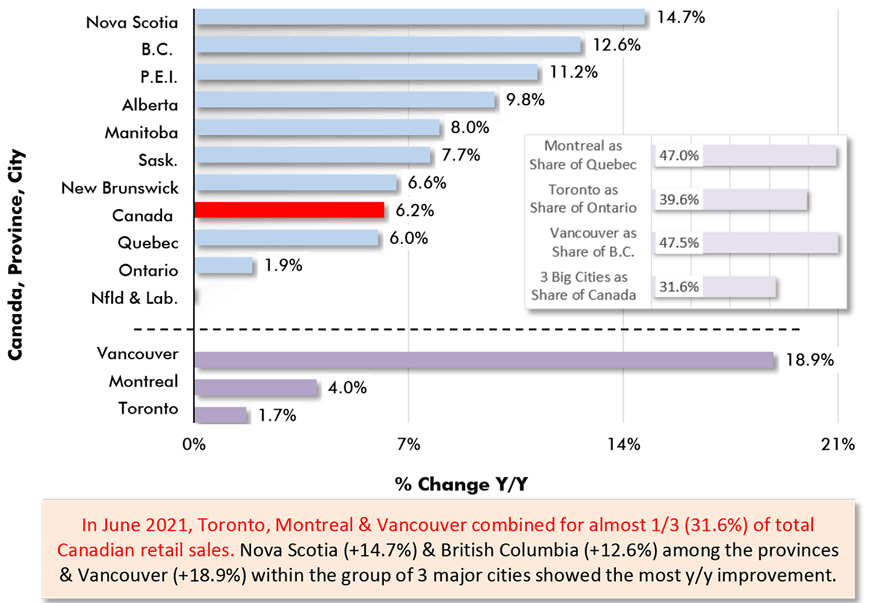
In June 2021, Toronto, Montreal & Vancouver combined for almost 1/3 (31.6%) of total Canadian retail sales. Nova Scotia (+14.7%) & British Columbia (+12.6%) among the provinces & Vancouver (+18.9%) within the group of 3 major cities showed the most y/y improvement.
Based on ‘current’ dollars (i.e., not altered for inflation) that have been seasonally adjusted.
Data source: Statistics Canada.
Chart: ÌìÃÀÓ°Ôº.
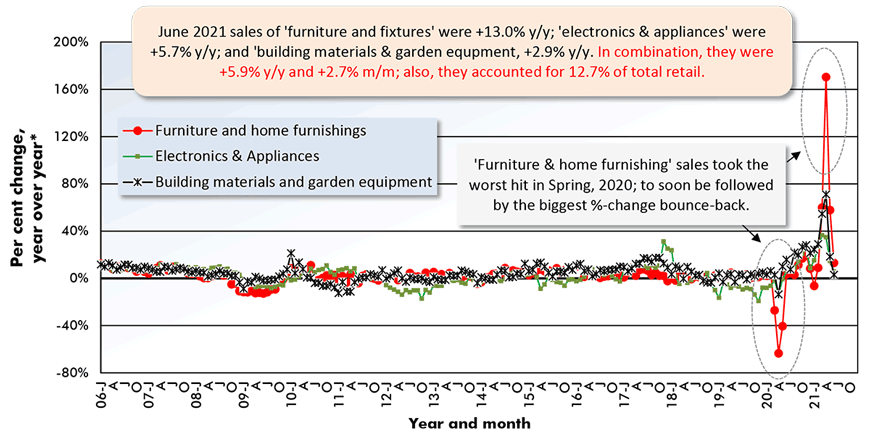
Graph 4: Canada Home-Related Retail Sales
June 2021 sales of 'furniture and fixtures' were +13.0% y/y; 'electronics & appliances' were +5.7% y/y; and 'building materials & garden equpment, +2.9% y/y. In combination, they were +5.9% y/y and +2.7% m/m; also, they accounted for 12.7% of total retail.
Latest data points are for June, 2021.
*"Year over year" is each month versus the same month of the previous year.
‘Based on ‘current’ (i.e., no accouting for inflation) dollar and seasonally adjusted data.
Data source: Statistics Canada.
Chart: ÌìÃÀÓ°Ôº.
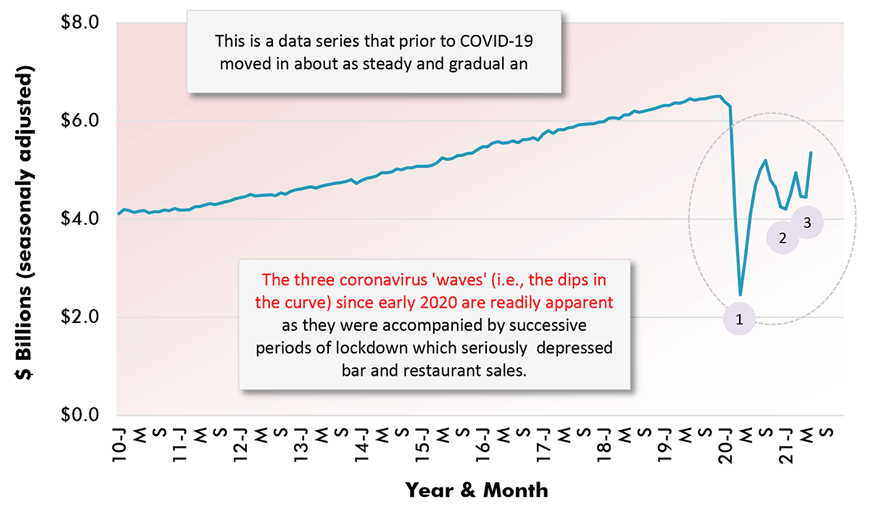
Graph 5: Canada Food Services & Drinking Places Sales*
The three coronavirus 'waves' (i.e., the dips in the curve) since early 2020 are readily apparent as they were accompanied by successive periods of lockdown which seriously  depressed bar and restaurant sales.
*Better know as bar and restaurant sales.
Data source: Statistics Canada Table 21-10-0019-01.
Chart: ÌìÃÀÓ°Ôº.
Graph 6: Total Retail Sales Since ‘Great’ Recession, U.S. & Canada
Based on Data Adjusted for Seasonal, Holiday & Trading Day Differences
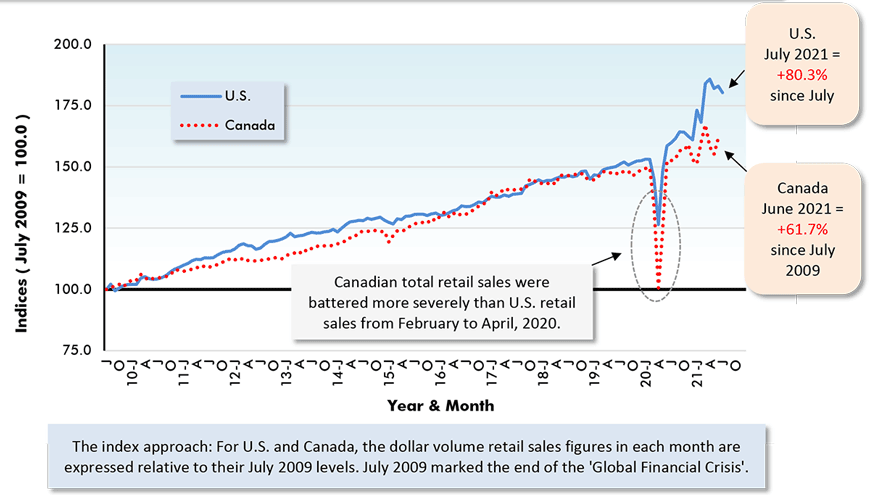
Canadian total retail sales were battered more severely than U.S. retail sales from February to April, 2020.
The latest released data point for the U.S. is July, 2021; for Canada, the data trails by a month, June 2021.
Data source: Statistics Canada and U.S. Census Bureau (Department of Commerce).
Chart: ÌìÃÀÓ°Ôº.

Please click on the following link to view the latest retail sales charts for the U.S. and Canada: CanaData Forecaster Charts & Tables – Retail Sales


Alex Carrick is Chief Economist for ÌìÃÀÓ°Ôº. He has delivered presentations throughout North America on the U.S., Canadian and world construction outlooks. Mr. Carrick has been with the company since 1985. Links to his numerous articles are featured on Twitter , which has 50,000 followers.

Print

Recent Comments

comments for this post are closed