The sustained decline in the number of active COVID-19 cases in Toronto since mid-July is clear evidence of the effectiveness of the rapid increase in the percentage of the metro area’s population that has been fully vaccinated. By early Fall, about 72% of Toronto’s population was fully vaccinated, slightly above the national rate of 71.5%.
Longer lockdowns hurt Toronto more than other CMAs
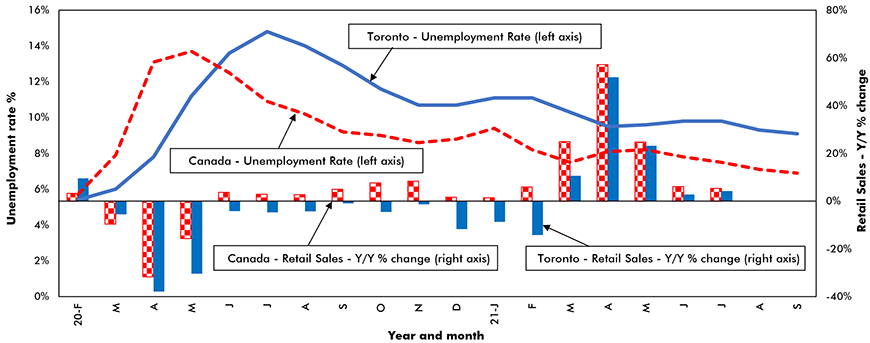
With a case count of 27/100k population vs 70/100k for the entire country, Toronto’s success against the epidemic, so far, has been well above par. However, by several measures, the metro area’s economic performance has been less stellar due to the . First, although employment in the Toronto CMA has increased by +7.5% over the past 12 months and the metro area’s workforce is +32,000 jobs above its pre-COVID-19 level of 3.444 million, the city’s unemployment rate, at 9.2%, is well above the national figure of 6.9%, and sits third highest among the country’s 35 census metro areas.
The climb in vaccination coverage accompanied by re-openings have boosted hiring in Toronto’s hospitality industry by a very strong +22% y/y; but that still leaves the sector’s jobs count below its pre-COVID peak by -21,000. Other sectors which have exhibited significant year-over-year gains in hiring include construction (+19%), health care and social services (+17%), and professional and technical services (+12%).
Gains in full-time hiring bode well for retail
In-store shopping restrictions have hobbled consumer spending in Toronto more than in the other major metro areas across the country. Whereas retail sales for the country as a whole are up by +16.2% year to date (YTD), sales in Toronto are ahead by just +7.5%. Despite the headwind of supply chain shortages, just over half the YTD gain in Toronto’s sales have been “driven” by a +15% jump in motor vehicles. Other notable retail sales increases have come in building materials, +16%, and furniture and home furnishings, +9%. Fuelled by the +120,000-jobs jump in full-time hiring in the third quarter and fewer COVID-19 restrictions, spending will pick up steam heading into next year providing it is not impeded by continuing supply chain disruptions.
Residential drives construction this year and again in 2022
Although COVID-19 restrictions sidelined Toronto consumers, they have had no significant impact on the metro area’s homebuyers. Fuelled by record-low interest rates and a +30% YTD increase in net permanent migration, existing home sales are up by +54% YTD (August) vs the same period in 2020 and by +48% compared to the first eight months of pre-pandemic 2019. This exceptionally strong surge in demand has outpaced the supply of both new and existing dwellings.
According to the , new listings were down by a third y/y in September, while the number of completed and unoccupied new homes hit a two-year low. This combination of strong demand and limited supply has driven the MLS Composite House Price Index up by over +17% year to date.
Going forward, while the recently reported sharp deterioration in affordability indicated by the will force more buyers to remain on the sidelines and contribute to a slowdown in home sales, several factors are likely to underpin both ownership and rental housing demand well into next year. These include a post-COVID-19 shift from working at home to working “in the office” and an increased desire to live closer to that office. Also, fewer restrictions on international travel will lead to an increased inflow of permanent residents.
Finally, over the past 12 months, full-time employment is up by +220,000 jobs (which is +130,000 over its pre-pandemic high). On the supply side, approvals of single, semi and row dwellings are up by +49% and those of condo-apartments by +40% YTD. Given that demand will likely continue to outpace supply over the next several quarters, upward pressure on prices is likely to persist well into 2022.
Rise in new business openings and TTC ridership
Non-residential construction paused in the first half of this year due to a scaling back of spending on retail projects, manufacturing facilities, hotels and restaurants, and trade and services projects. Following this hiatus, the outlook for non-res construction brightens as design plans go forward for transportation terminals and tunnels in several locations and for entertainment sites, offices, and retail stores. According to Cushman Wakefield, office vacancy rates in the Toronto CMA are at an 18-year high of 11.8%. This will dampen office construction in the near term.
However, the steady increase in TTC ridership since May plus an uptrend in office leasing activity in the central and suburban parts of the city, indicate the metro area’s economic pulse is quickening. The argument for an improved outlook is supported by a +5.8% YTD increase in business openings in Toronto, the fifth highest among the country’s 35 census metro areas.
John Clinkard has over 35 years’ experience as an economist in international, national and regional research and analysis with leading financial institutions and media outlets in Canada.
Retail Sales Y/Y % Change and Unemployment Rate % – Toronto vs Canada

Chart: ����ӰԺ – CanaData.
Please click on the following link to download the PDF version of this article:


Recent Comments
comments for this post are closed