There’s much to cover, so let’s jump right into a discussion of the some of the most interesting information to be gleaned from the latest public and private sector data releases. ��
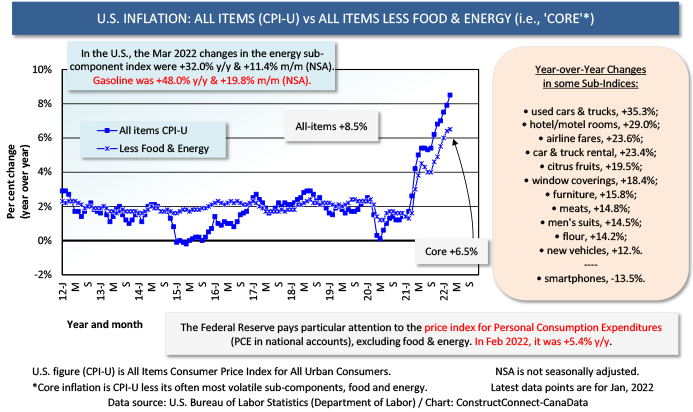
 (1) Grizzled old economists, who have lived through previous periods of rapid price inflation, have never put their memories of those difficult periods fully behind them. For nearly two decades, they’ve annoyed their younger colleagues by repeatedly warning of the potential risks of inflation when it seemed the threat of that slumbering bugbear had forever been driven from the landscape. Turns out, they were right. March 2020’s U.S. Consumer Price Index (CPI-U) increase of +8.5% y/y was the highest in 40 years. The ‘core’ rate of inflation, which excludes volatile food and energy items, was +6.5% y/y in the latest month.
Graph 1

(2) No doubt +8.5% y/y for the all-items and urban consumer CPI seems scary. Historically, though, it’s hardly unique. From January 1950 through December 1981, a period of 384 months, there were 65 months in which general price inflation was more rapid than +8.5% y/y. March 1980 coughed up the highest figure, +14.8% y/y. 1974-1975 was another period of formidable advances. It resulted from OPEC flexing its muscles for the first time ever and implementing a multifold increase in the global price of oil.
(3) There’s another measure of inflation that appears in the monthly Personal Income and Outlays report published by the Bureau of Economic Analysis (BEA). It’s the price index for Personal Consumption Expenditures (PCE), excluding food and energy. This is the measure said to be given most scrutiny by the Federal Reserve when it’s assessing the need for interest rate adjustments. The latest (February 2022) PCE price index advance was +5.4%, not as dramatic as for the CPI. The Fed will be proceeding with incremental bumps in its key policy-setting rate, nonetheless, probably until a level somewhere close to 3.00% is attained.
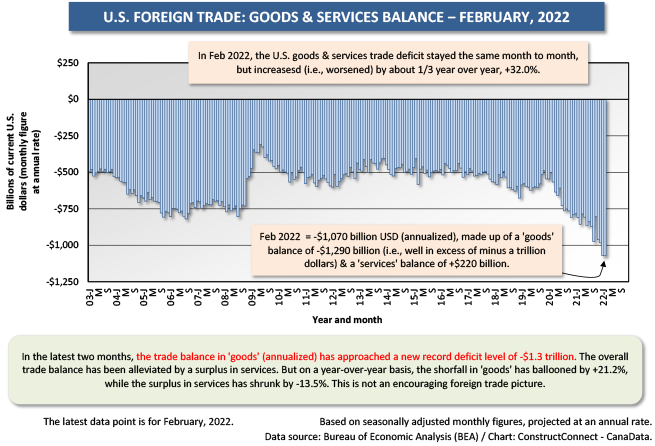
(4) Elsewhere in the Personal Income and Outlays report, there’s a set of numbers many analysts are finding worrisome. The month-to-month change in ‘real’ (i.e., inflation-adjusted) disposable personal income has been negative in every month since August of last year. Stated as simply as possible, DPI is income minus taxes and it’s a key driver of the 70% of gross domestic product that is dependent on consumer spending. GDP growth is healthiest when DPI is on an upswing. The fact it’s currently struggling is fueling talk of a possible looming recession.(5) The monthly U.S. foreign trade numbers have taken a distinctly negative turn. February’s annualized shortfall in the trade of ‘goods’ was nearly -$1.3 trillion, an all-time worst. ‘Services’ trade, which usually provides a positive counterweight, was true to form at +$220 billion. But it’s important to point out that +$220 billion was -13.5% compared with February 2021’s surplus. The overall trade balance in goods and services, annualized, is now slightly more than -$1.0 trillion. Normally, this would weigh on the value of the U.S. dollar. But support for the greenback is coming from the geopolitical realm. Uncertainty tied to the fighting in Ukraine is causing international currency traders to seek the safest of havens, which continues to be what Uncle Sam has in his wallet.
Graph 2

(6) U.S. consumer confidence, as calculated by the Conference Board, improved a little in March. Relative to a 1985 base equal to 100.0, the index now stands at 107.2, up from 105.7 in February. To provide further perspective, however, the index fluctuated between 120.0 and 140.0 during all the months of 2018 and 2019, when no thought was being given to the possibility of an imminent health crisis. The Conference Board’s Present Situation Index jogged upwards in March, but its Expectations Index took a hit from shockingly higher gas prices and anxiety over where Russia’s invasion of Ukraine might eventually lead. The Conference Board’s assessment of CEO confidence, carried out in collaboration with The Business Council, fell for a third quarter in a row in Q1 2022; but there is still more positive than negative sentiment.
(7) ����ӰԺ’s latest monthly starts statistics perfectly illustrate the dichotomy that has emerged between strong residential versus weak nonresidential construction markets over the past several years. The dollar volume of grand total construction starts in March 2022 was the same (0.0%) as the average for grand total construction starts in March over the previous five years. The dollar volume of residential starts in March 2022, though, was +21.7% compared with its five-year average for March, from 2017 to 2021. The dollar volume of nonresidential starts in March 2022 was -14.3% compared with its average for March during the prior five years.
(8) Finally, here are a few last words on extraordinary inflation. There’s a perverse way in which it may have a silver lining. A persisting problem for the economy, magnified by the pandemic, has been a shortage of labor. Since the Spring of 2020, many elderly workers have brought forward their retirements. The individuals hurt most by runaway price increases are those on fixed incomes. Many recent retirees are re-assessing their financial situations and not coming away feeling ever so confident. Instead, a good number of them will likely conclude that a return to the workforce, even if only temporary, may place them in significantly better circumstances.
Alex Carrick is Chief Economist for ����ӰԺ. He has delivered presentations throughout North America on the U.S., Canadian and world construction outlooks. Mr. Carrick has been with the company since 1985. Links to his numerous articles are featured on Twitter��, which has 50,000 followers.


Recent Comments
comments for this post are closed