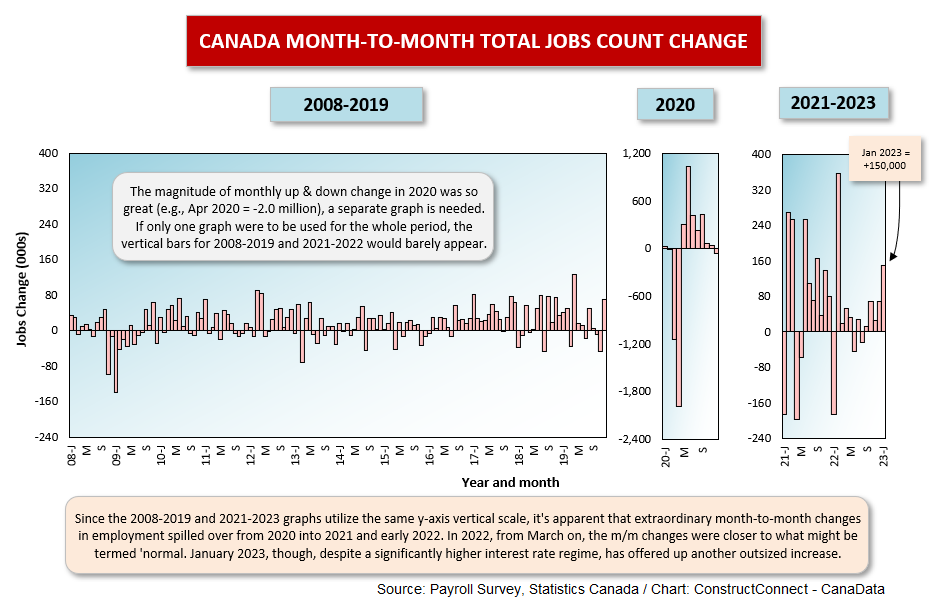
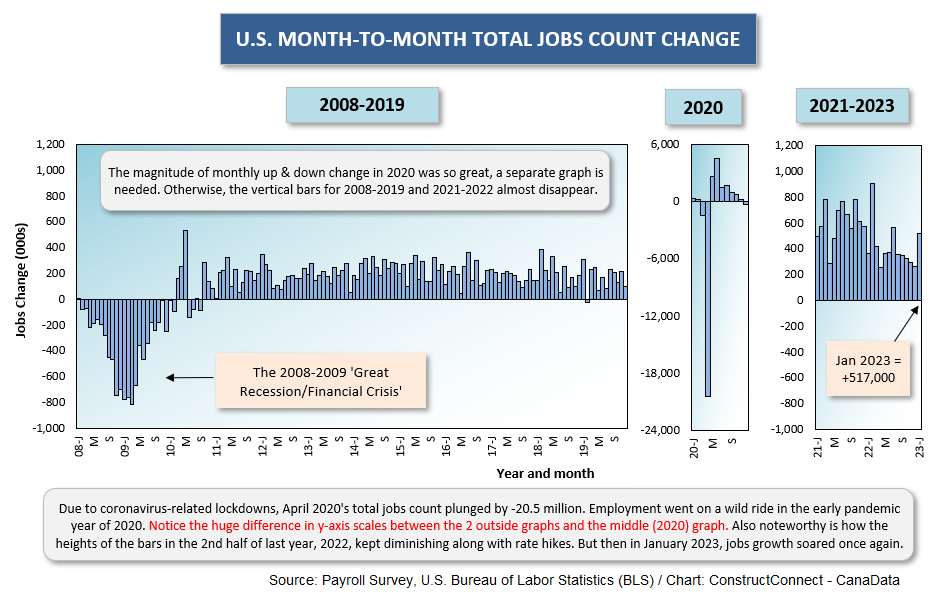
In January, the U.S. recorded a big employment increase, +517,000 jobs. In the same month, and with a considerably smaller population base, Canada followed suit, +150,000 jobs.
 In relative terms, since the U.S. has a population that is nine times that of Canada’s, the jobs pickup north of the border was even more impressive.
The +150,000-employment gain for Canada was the best monthly increase in nearly a year, dating back to February 2022 (+358,000), when pandemic-devastated sectors were springing back to life.
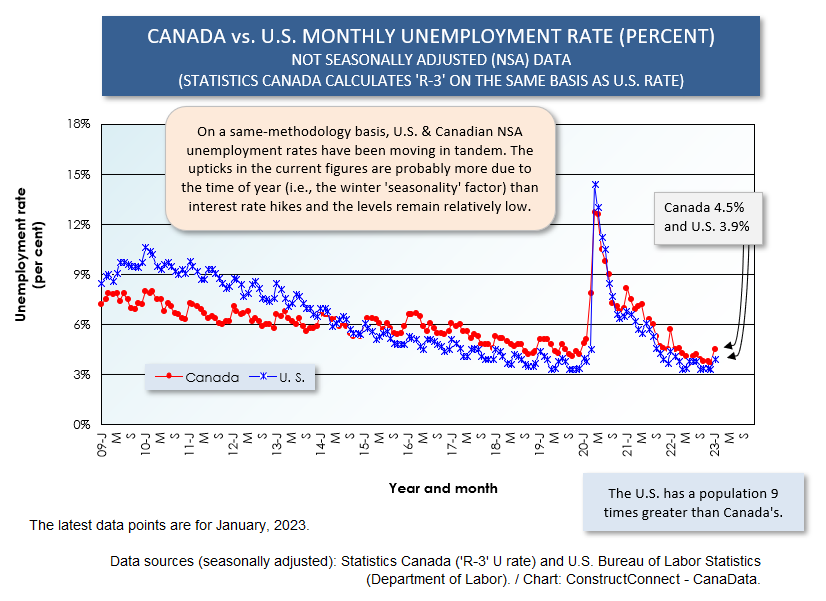
Canada’s seasonally adjusted (SA) unemployment rate stayed the same in January as in December, 5.0%. The not seasonally adjusted (NSA) unemployment rate calculated using the same methodology as is adopted in the U.S. rose to 4.5% from 3.7%. The 4.5% figure, however, wasn’t far off the comparable U.S. NSA unemployment rate of 3.9%.
Graph 3 shows how closely U.S. and Canadian U rates have been tracking. It also illustrates the minimal negative impacts on labor markets that have occurred so far from the hikes in interest rates on both sides of the border.
Employment in Canada’s construction sector marched ahead by +16,000 jobs in the latest month. In the past four months, and defying expectations of a fall-off in new housing construction due to higher rates, the number of construction jobs has soared by +66,000.
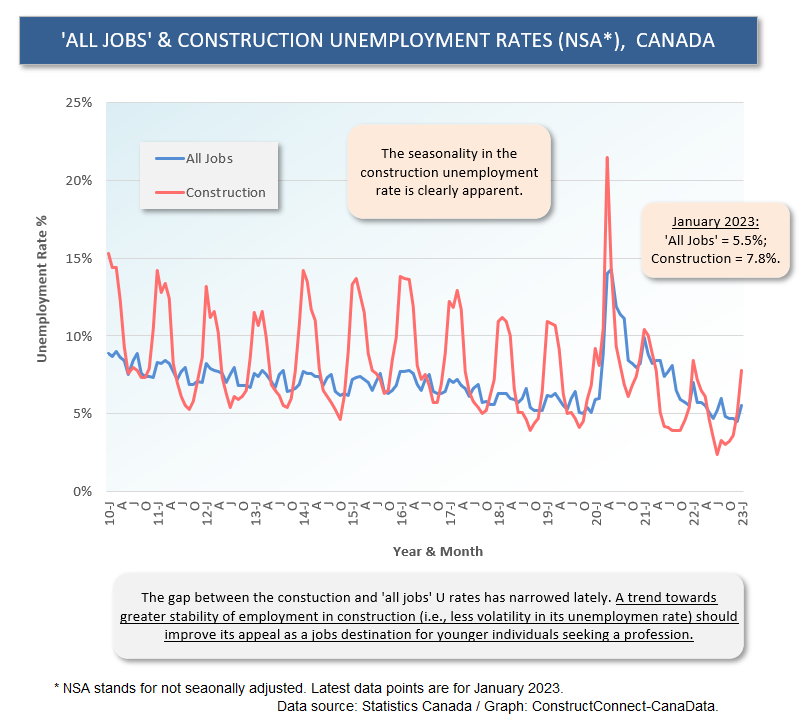
The NSA U rate for construction across Canada is presently 7.8%. The two provinces most conspicuously under that figure are Ontario, 5.7%, and British Columbia, 4.3%.
In the U.S., there is still a considerable excess in the total jobs count for manufacturing versus construction, 13.0 million to 7.9 million. Such is not the case in Canada.��
On that subject, Graph 4 tells an amazing story. In the 00s, employment in Canadian manufacturing was knocked down by automation and offshoring. Since then, the production-line jobs count has stayed flat.
Since 2000, the number of construction jobs in the country has been on an upwards incline. The slope of the climb was especially steep in the earlier years, when there were numerous mega-sized energy-related and other resource projects across the nation, especially in Alberta.
In the past couple of years, a return to a steeper slope for construction jobs has reappeared.
In 2000, there were approximately three jobs in manufacturing for every one job in construction. Presently, the relationship has become nearly one-to-one. The total jobs count for construction has become 90% of the total jobs count for manufacturing.
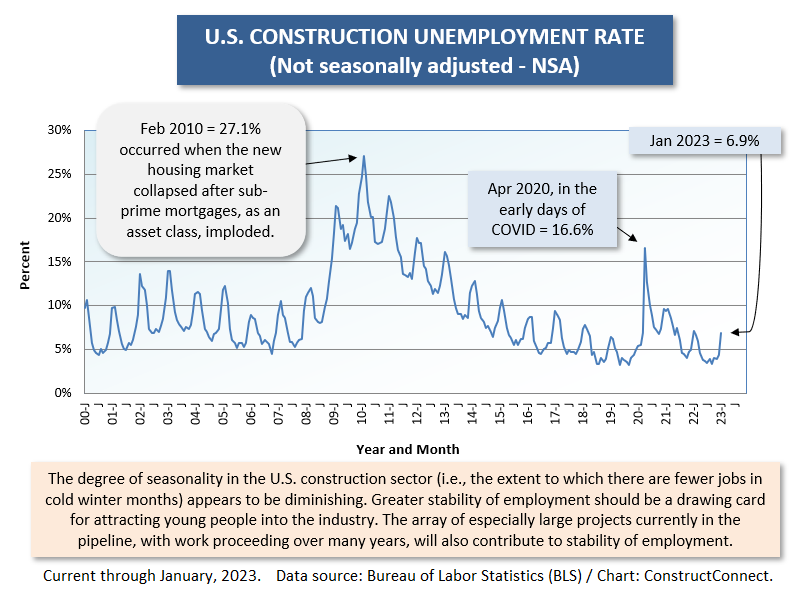
Promoting this message should be helpful in attracting young workers to the construction industry. Also positive for recruitment are indications that the extreme swings in employment in the industry due to seasonality, versus the rest of the economy, are diminishing (see Graph 6).��
Wage Gain Deceleration
One of the arguments supporting the proposition that 2023 will see a recession is that growth in ‘real’ (i.e., after adjustment for inflation) disposable incomes is suffering a setback, meaning that consumer spending won’t be playing as active a role in supporting GDP.
Another way to look at this issue is to consider ‘purchasing power’. When the year-over-year increase in wages doesn’t keep up with inflation, there’s a loss of purchasing power. You can no longer afford to buy the same volume of goods or services that you were able to purchase previously.
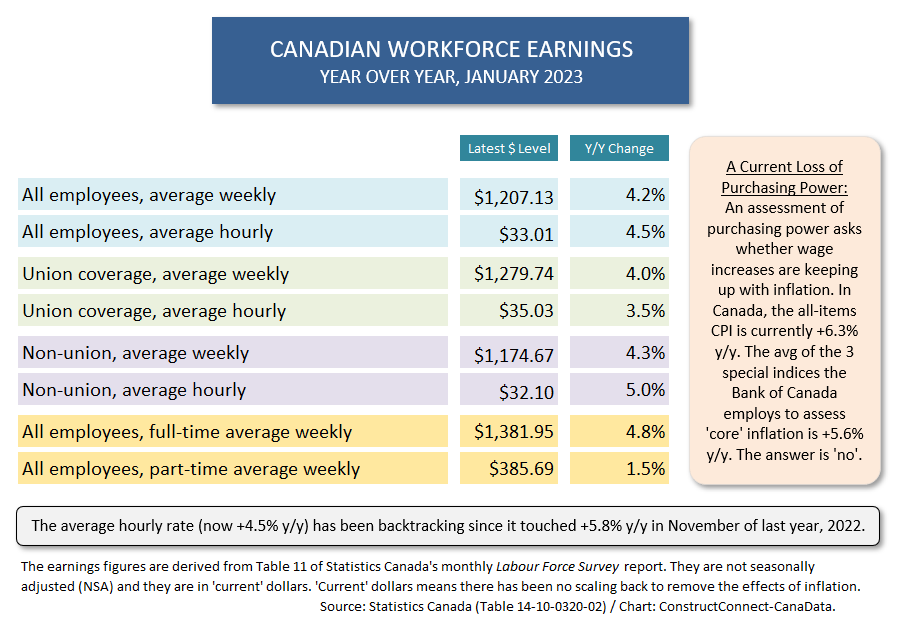
Table 1 sets out the dilemma for Canadians. In none of the various earnings categories are there year-over-year gains that are substantial enough to match the annual increase in the Consumer Price Index (CPI), +6.3%.
The comparison that is most often drawn is between the hourly wage increase for all jobs and the all-items CPI leap. The former has settled down to +4.5% y/y after reaching its most recent peak of +5.8% y/y in November of last year.
A similar situation prevails in the U.S. where the latest inflation number came in at +6.5% y/y versus the ‘all jobs’ hourly compensation advance of +4.4%. Purchasing power is a casualty.
Graph 1
Graph 2
Graph 3
Graph 4
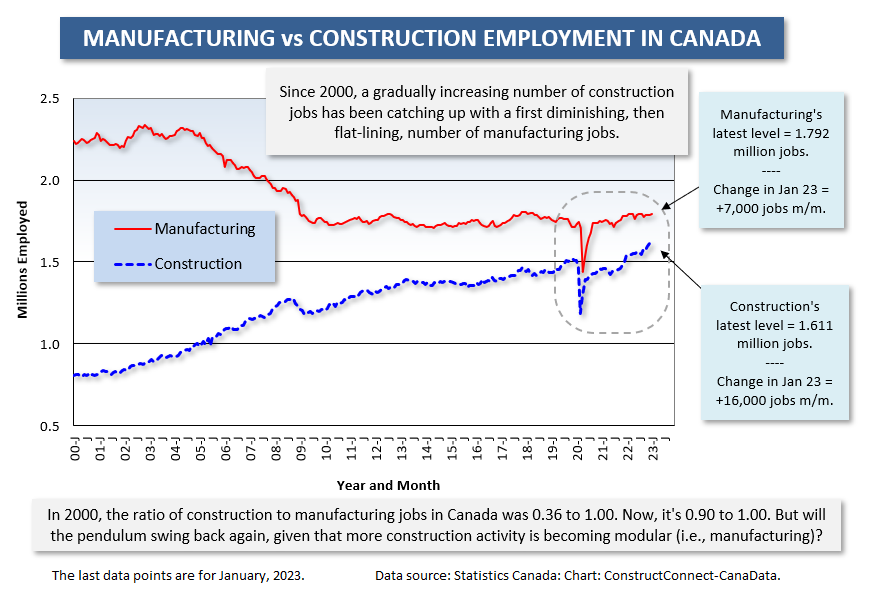
Table 1
Graph 5
Graph 6
Alex Carrick is Chief Economist for ����ӰԺ. He has delivered presentations throughout North America on the U.S., Canadian and world construction outlooks. Mr. Carrick has been with the company since 1985. Links to his numerous articles are featured on Twitter��, which has 50,000 followers.


Recent Comments
comments for this post are closed