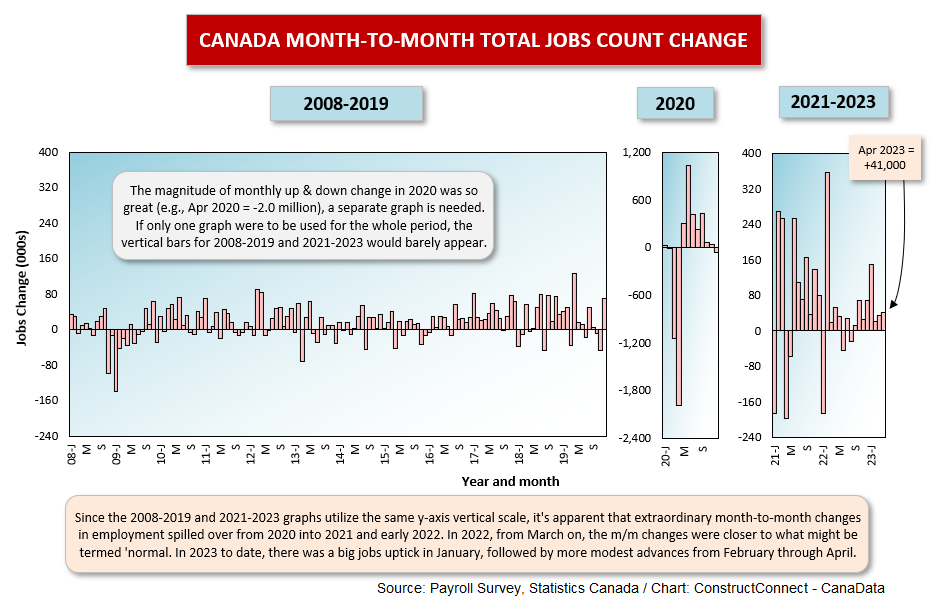
Similar to what has been occurring in the United States, labour market conditions in Canada have remained robust despite significant hikes in interest rates orchestrated by the nation’s central bank. April’s nation-wide total jobs count north of the border rose by +41,000 according to the latest conducted by Statistics Canada.
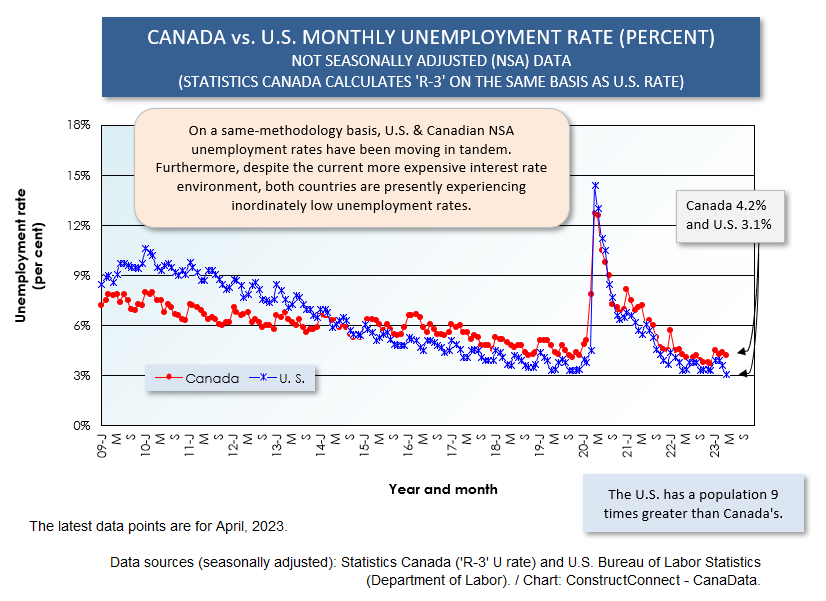
 The seasonally adjusted ‘headline’ unemployment rate stayed at the 5.0% level where it’s been for five months in a row. The not-seasonally adjusted (NSA) unemployment rate calculated using the same methodology as is adopted in the U.S., known as the R-3 U rate, is perhaps more relevant. In April, R-3 was 4.2%, only a little above the comparable U.S. figure of 3.1%. Graph 1 shows how closely the Canadian and U.S. U rates have been aligned going back at least ten years.
Through the beginning one-third of this year, the average monthly increase in total employment in Canada has been +62,000 jobs. From January to April of last year, the average monthly climb was almost the same, +61,000 jobs.
The change in construction employment in the latest month was +7,000 jobs. The change in manufacturing employment was +2,000 jobs. The difference between the total number of manufacturing jobs in Canada, at 1.795 million, and the total number of construction jobs, 1.598 million, keeps narrowing. Year-over-year employment in manufacturing in April was a mere +0.2% to construction’s +3.4%. The total number of jobs in Canada is now ahead by +2.1% y/y.
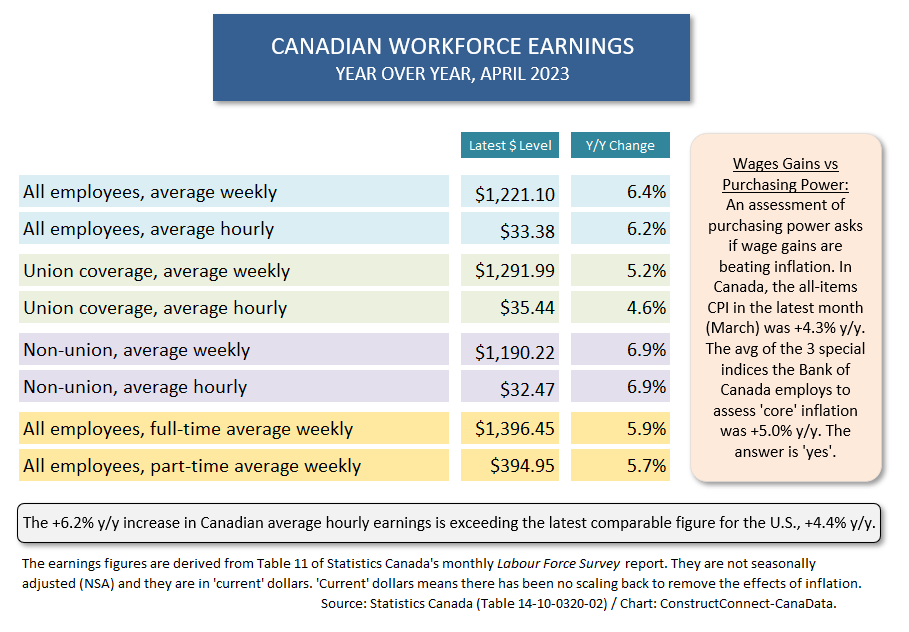
The jump in average hourly earnings for all jobs in Canada has been +6.2% according to Statcan’s latest reckoning. The +6.2% advance is spread over all industries, union and non-union, full and part-time, and may well not reflect one’s own experience. Nevertheless, it does suggest that Canadians are staying ahead of the game with respect to purchasing power, since the all-items Consumer Price Index (CPI) inflation rate has been beaten down to +4.3% y/y.
The Bank of Canada’s key policy-setting interest rate, the ‘overnight rate’, is currently 4.50% and will almost certainly be kept static into late-stage 2023, when some easing may be initiated. Of course, this is under the hypothesis of no huge shock on the inflation front.
Oxford Economics, which is ����ӰԺ’s partner in construction ‘starts’ and ‘put-in-place’ forecasting, is calling for Canada’s ‘real’ (inflation adjusted) gross domestic product (GDP) change to be -0.3% in 2023, +1.3% in 2024, and then a much improved +3.5% in 2025. The economy is being forced to play a waiting game until it can sail on smoother waters.
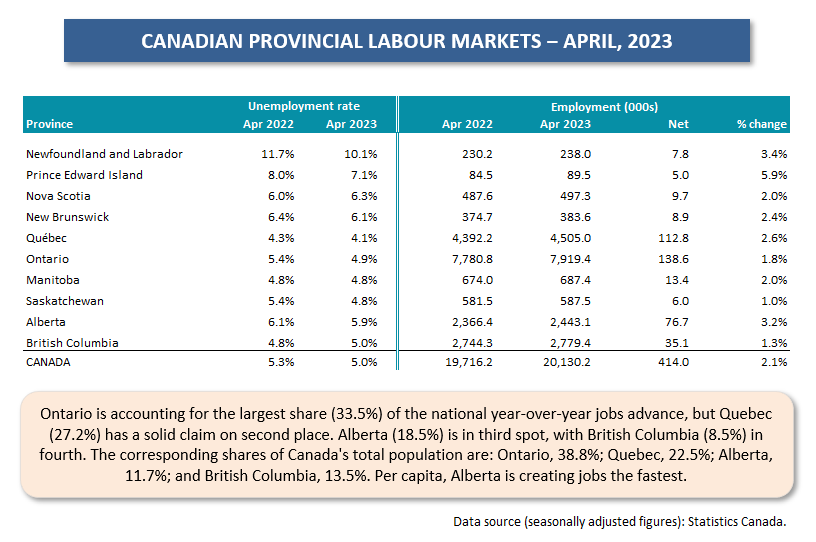
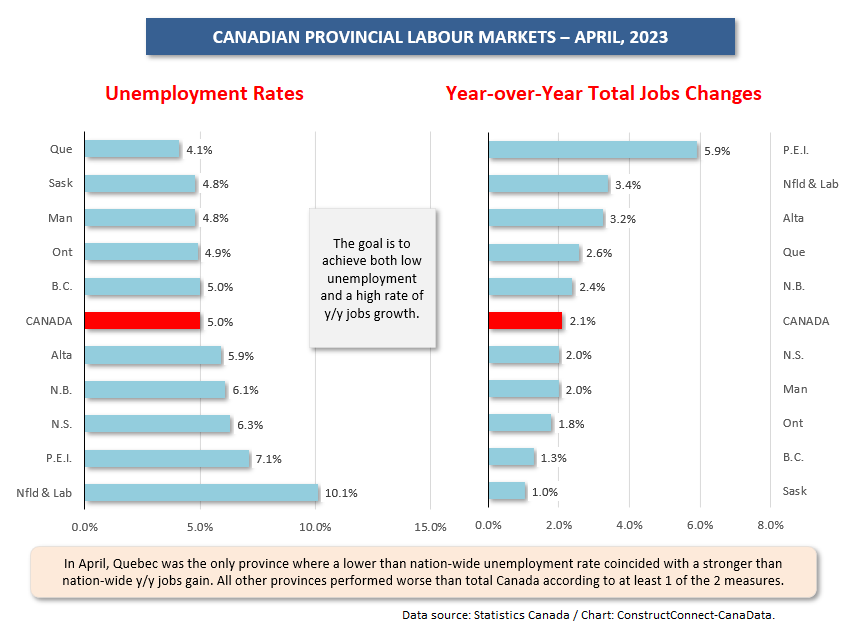
Provincially, only Quebec can boast of having an unemployment rate that is lower than the national figure (4.1% vs 5.0%) and a rate of jobs creation higher than the Canada-wide statistic, (+2.6% to +2.1%). Unexpectedly, though, Quebec among the nation’s largest-population provinces, is having the poorest year so far for housing starts in number of units, -41% year to date. Alberta is at 0.0%; Ontario, +3.0%; and B.C., an impressive +39%.
Graph 1
Graph 2
Graph 3
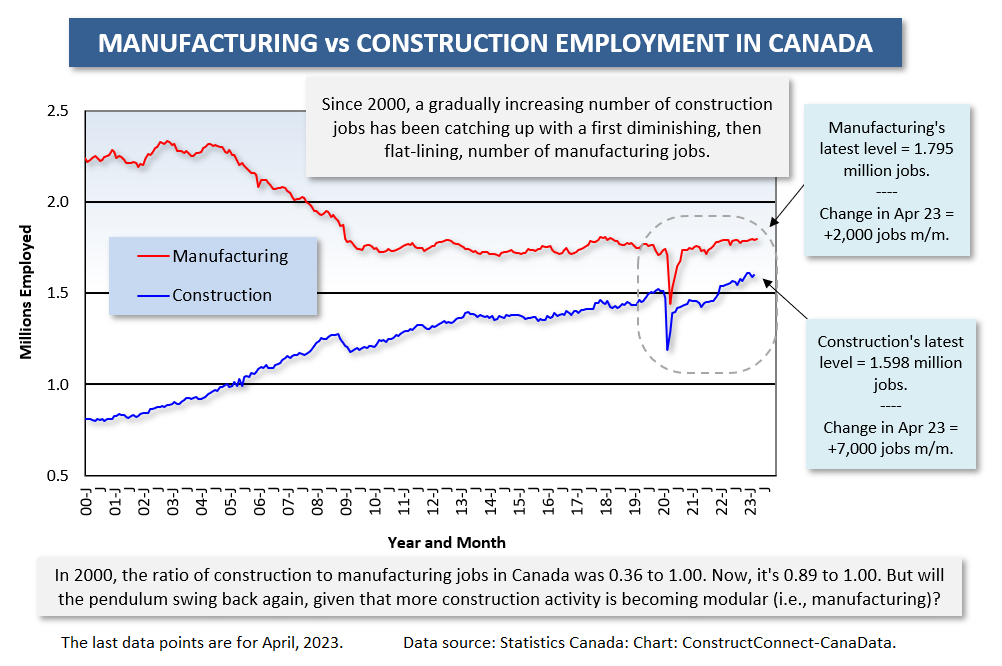
Table 1
Graph 4
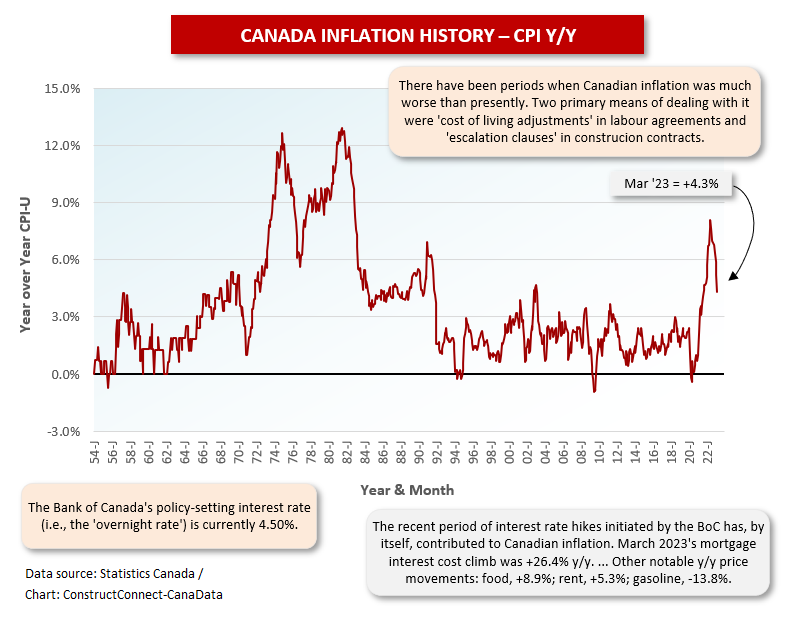
Table 2
Graph 5
Alex Carrick is Chief Economist for ����ӰԺ. He has delivered presentations throughout North America on the U.S., Canadian and world construction outlooks. Mr. Carrick has been with the company since 1985. Links to his numerous articles are featured on Twitter��, which has 50,000 followers.


Recent Comments
comments for this post are closed