Forecaster Charts & Tables

Extras

Demography, infrastructure, building product costs and wages are also determinants of the construction sector’s health.

View Economic News

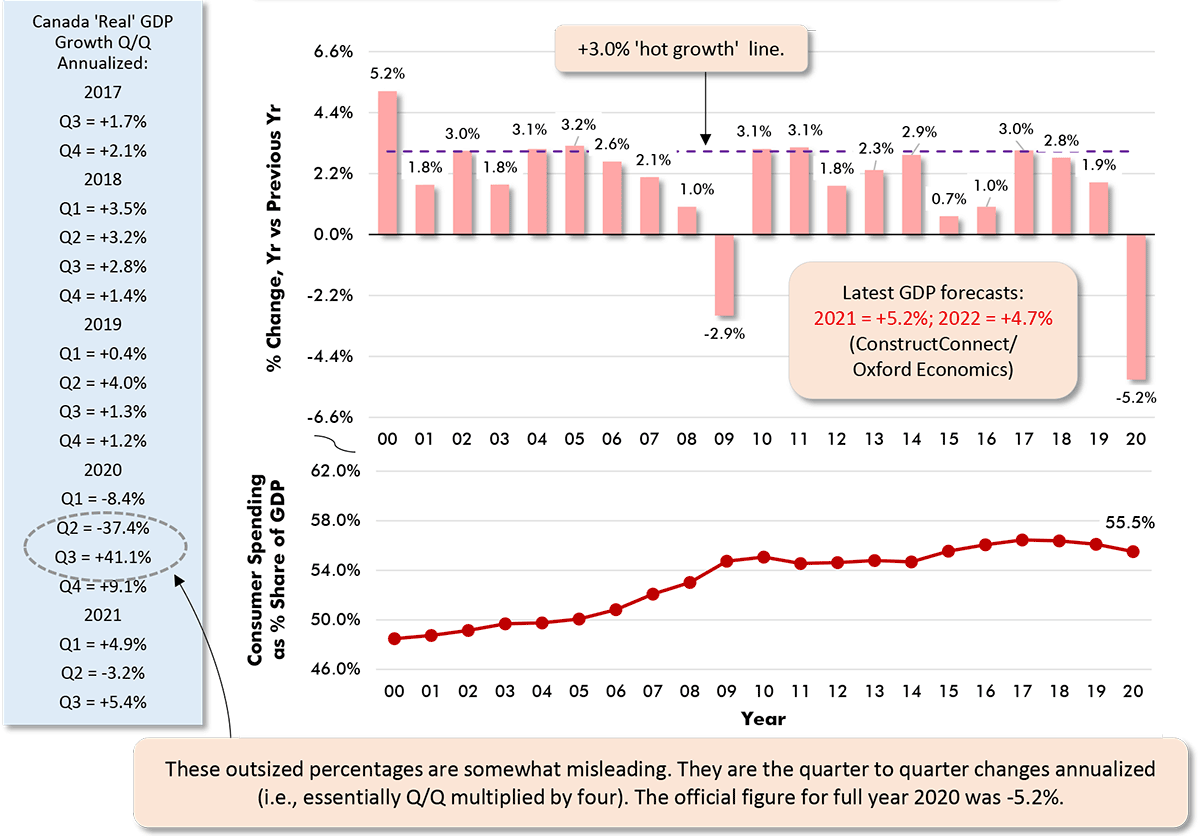
Canada 'Real' GDP Growth, Y/Y & Q/Q

These outsized percentages are somewhat misleading. They are the quarter to quarter changes annualized (i.e., essentially Q/Q multiplied by four). The official figure for full year 2020 was -5.2%.

Data source: Statistics Canada Table 36-10-0104-01 / Chart: ÌìÃÀÓ°Ôº-CanaData.

U.S. 'Real' GDP Growth, Y/Y & Q/Q
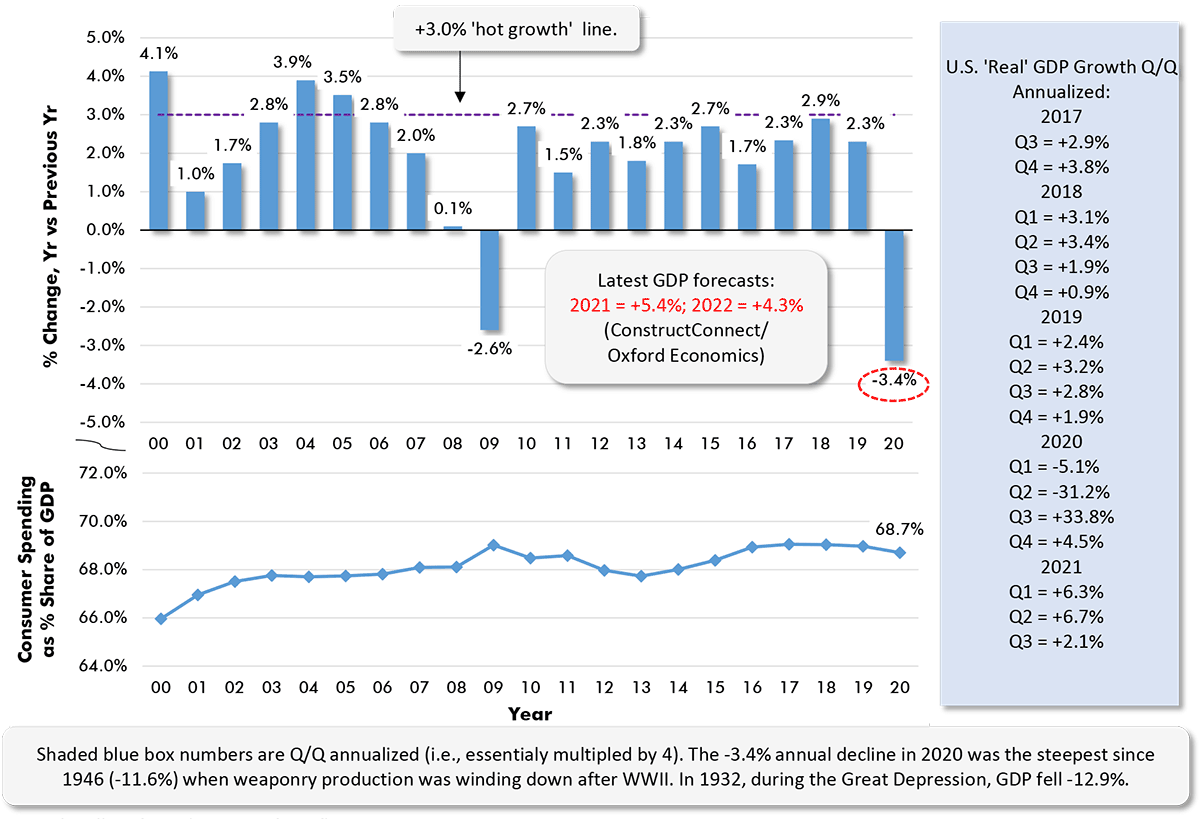
Shaded blue box numbers are Q/Q annualized (i.e., essentialy multipled by 4). The -3.4% annual decline in 2020 was the steepest since 1946 (-11.6%) when weaponry production was winding down after WWII. In 1932, during the Great Depression, GDP fell -12.9%.

‘Real’ is after adjustment for inflation.

Data source: Bureau of Economic Analysis (BEA) / Chart: ÌìÃÀÓ°Ôº-CanaData.

Household Savings Rate in Canada
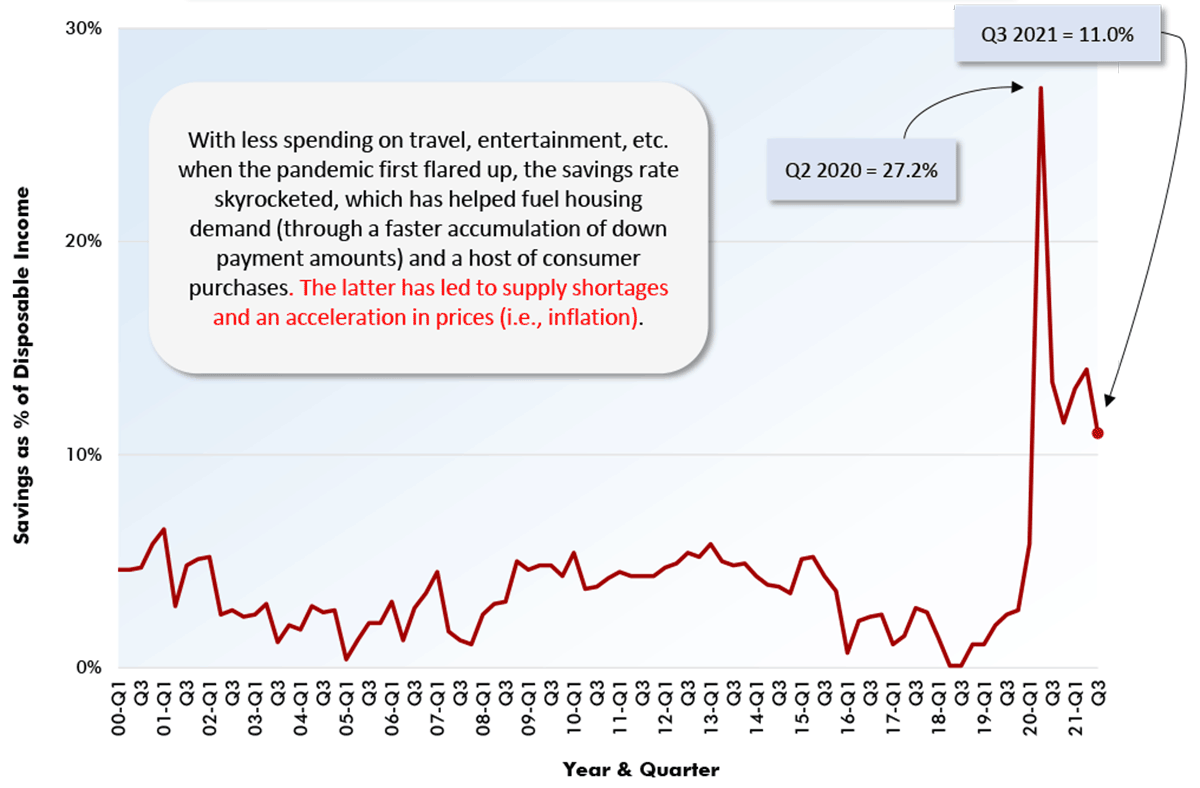
With less spending on travel, entertainment, etc. when the pandemic first flared up, the savings rate skyrocketed, which has helped fuel housing demand (through a faster accumulation of down payment amounts) and a host of consumer purchases. The latter has led to supply shortages and an acceleration in prices (i.e., inflation).

Data source: Statistics Canada/Chart: ÌìÃÀÓ°Ôº — CanaData.

Personal Savings Rate in the U.S.
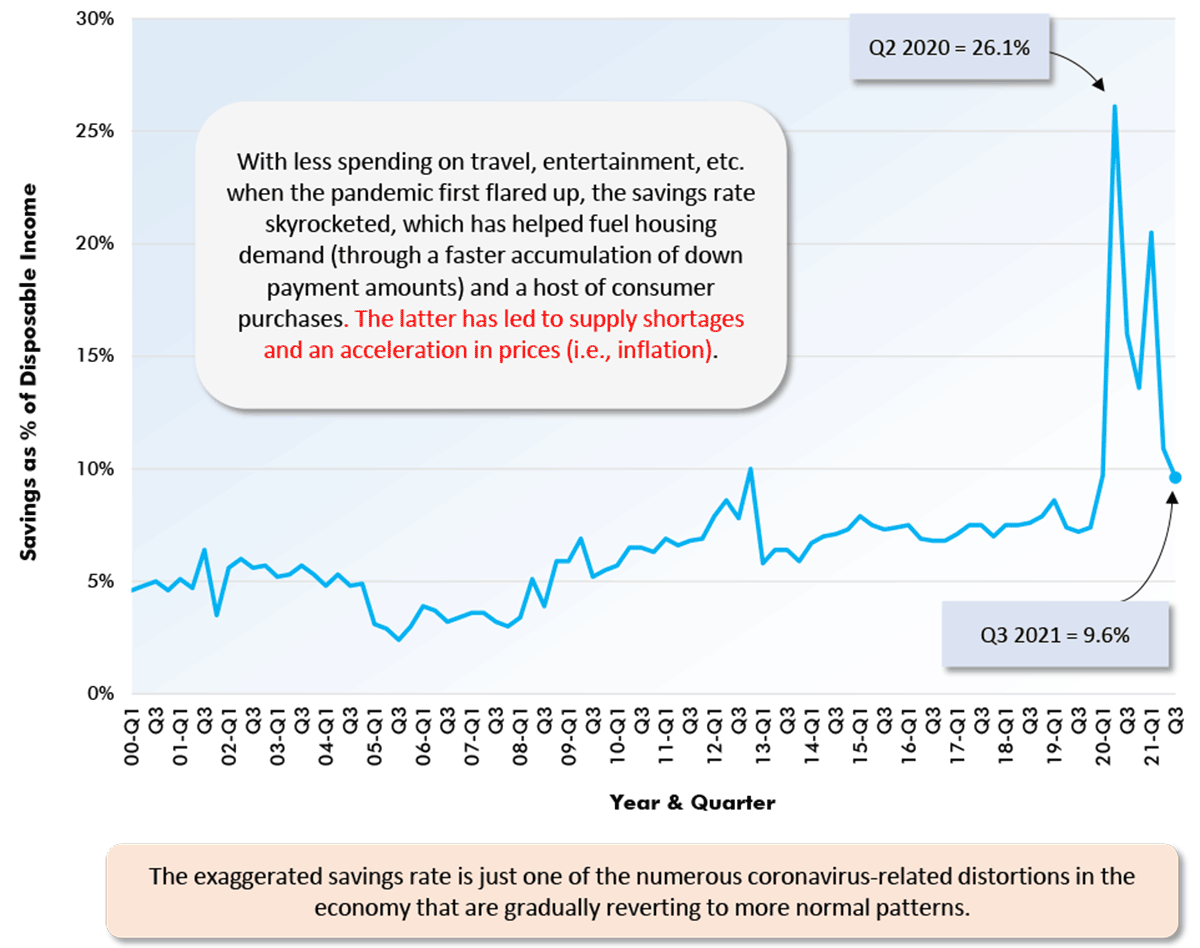
With less spending on travel, entertainment, etc. when the pandemic first flared up, the savings rate skyrocketed, which has helped fuel housing demand (through a faster accumulation of down payment amounts) and a host of consumer purchases. The latter has led to supply shortages and an acceleration in prices (i.e., inflation).

Data source: Bureau of Economic Analysis/Chart: ÌìÃÀÓ°Ôº — CanaData.